
Beszel System Stats
Time-series charts for CPU, memory, disk, network, and Docker container metrics from Beszel.
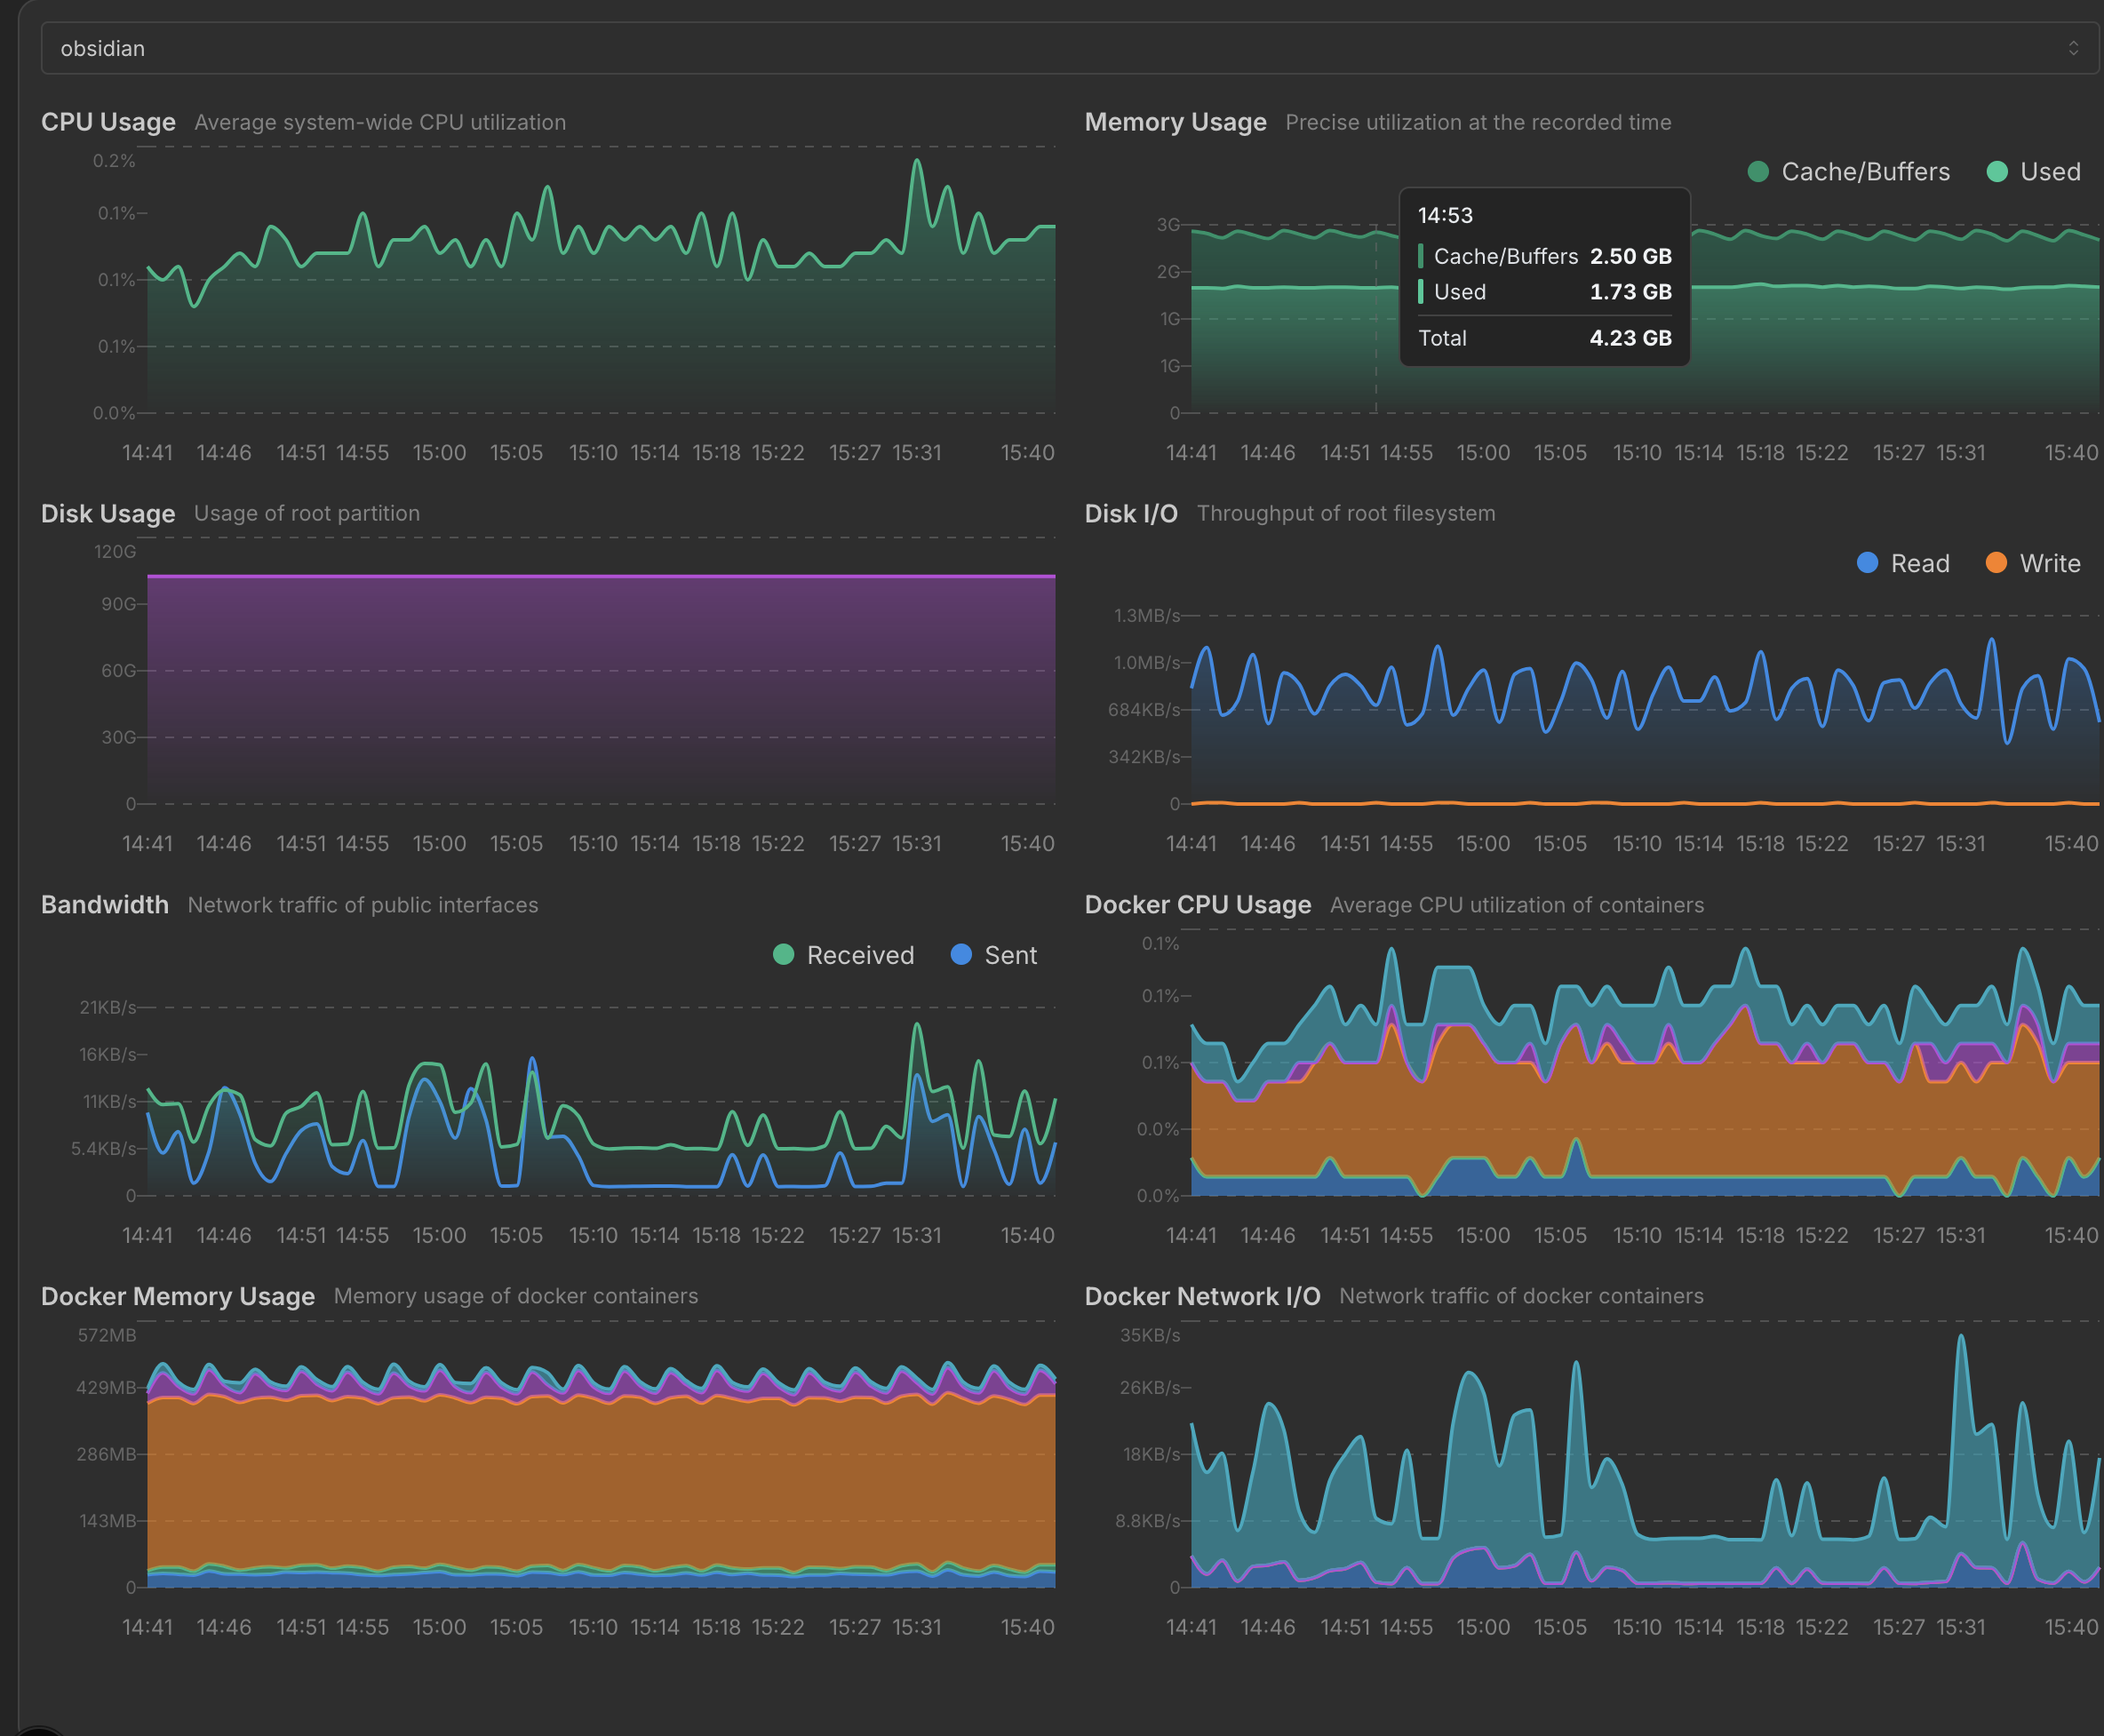
This widget displays time-series charts for a selected Beszel system, including CPU, memory, disk, network, and Docker container metrics. The Disk Usage and Disk I/O charts combine the root disk and every extra filesystem reported by Beszel, with separate read and write series for each filesystem in the I/O chart. Use the widget controls to switch between the realtime Live view and historical periods ranging from 1 hour to 30 days. Live view keeps a one-minute window and pauses while the browser tab is hidden. If the live stream drops, the widget now shows the connection failure state immediately and can switch back to historical data.
Screenshots
Supported Integrations

Adding the widget
Add the widget from the board's Add board content menu in edit mode.
Configuration
| Name | Description | Values | Default value |
|---|---|---|---|
| System | The Beszel system to display stats for. Searchable select populated from the integration. | String | First available system |
| Time period | The time range for chart data. '1 Minute' enables live streaming via PocketBase SSE (requires Beszel agent >= 0.13.0) |
| 1 Hour |
| Show CPU | Displays the CPU usage chart | yes / no | yes |
| Show memory | Displays the memory usage chart | yes / no | yes |
| Show disk | Displays the disk usage chart | yes / no | yes |
| Show disk I/O | Displays the disk I/O chart | yes / no | yes |
| Show network | Displays the network chart | yes / no | yes |
| Show Docker CPU | Displays Docker container CPU usage chart | yes / no | yes |
| Show Docker memory | Displays Docker container memory usage chart | yes / no | yes |
| Show Docker network | Displays Docker container network chart | yes / no | yes |